I finally got around to cleaning up my dashboard and you can check it out here. It’s still pretty hacked together but the code is actually readable now!
EDIT: I’m collapsing all the back and forth about embedding the screenshot into this post…
Awesome! Thanks so much for sharing this!
I’m curious, is it possible to hotlink to a dropbox-hosted image? Looks like yes: […]
I put it in my Public folder on Dropbox first. Maybe that was the difference?
Oh, what about removing the querystring (“?dl=0”) from the URL (so it ends in “.png”)?
(If all that fails then my only theory is I have some kind of grandfathered dropbox account that allows hotlinking.)
Oh my, it may have just been a matter of having the URL on its own line! I just edited your original post and it worked! (Ok, I’ll try to clean up all this back and forth now!)
Forked it, made a mess with git commits and branches. (I think I’ve tidied it up again now.)
Got it running.
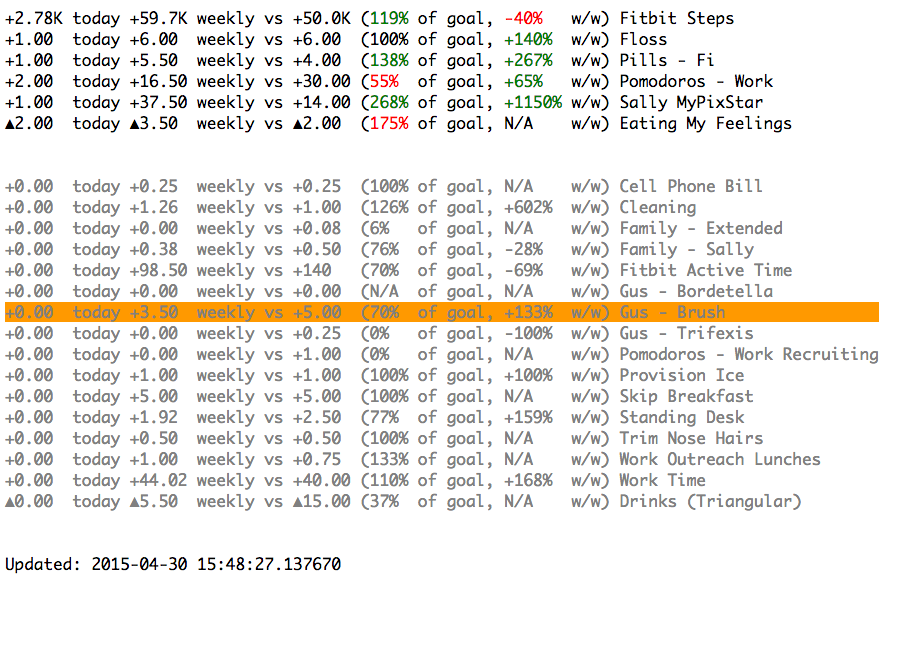
What am I looking at?
Any clues as to what the columns are?
I admit it’s not super well documented, but I think the numbered list in the top of file comments on beedash.py correspond to the columns in the display.
TL;DR the “weekly” rate is the weekly average over the last two weeks. The first % is comparing that rate to the goal rate, and the second % is comparing that rate to the rate as it was two weeks ago.
Passive aggressive bug report: it’d be handy if all goals that are on emergency days got highlighted.
I had one yesterday that I didn’t notice through other means (because I’ve got notifications off and it’s on the back burner, so totally my fault) but I’m surprised not to find it among the 26 goals selected to be displayed on my dashboard.
Why 26? It makes for a nice screenful, I suppose. I’ve currently got 27 on the frontburner and 16 on the backburner. The dashboard shows a mix of each.
Ironically, this bug report was made possible by my failure to sync Anki yesterday. I studied the cards on mobile but didn’t think to update Beeminder when I got back to the apartment.
Alright, I updated it to support all goal types except custom goals with special aggday functions.
It guesses how the goal should be handled by looking at yaw, dir, odom, and aggday. This makes it handle the 6 basic goals correctly plus any custom goal which matches one of them.
It doesn’t actually respect the aggday setting, but rather treats all non-“sum” goals as if they were “last”. So if your weight yesterday was 150 and today you had data points of 150,160 it will say you gained 10 pounds today. Let me know if this is too annoying.
Since it needs at least two data points to make a rate, and it only fetches data up to 4 weeks old, if your data points are very sparse you may not see the rate you expect.
Let me know if you see any bugs or have any other feature requests!
Hey hey! I now have 43 goals in my beedash.html. Thanks.
Two observations:
Only 1 of my 3 eep days appears ‘above the fold’, so the sort order may not be the most useful.
You can probably safely exclude goals that have ended
It’d be insane for API clients to have to interpret the aggday functions. Chime in on the API v2 thread if you figure out how the API should expose the aggregated value alongside the raw value. It’s special-purpose use cases like your dashboard calculations that’ll show the way.
Hah wow 43 goals! With my measly 25 goals the dashboard still works “at a glance” in the sense that the eep highlighted days still stand out. Do you think it would be better to have 3 sections? One for eep goals, one for goals you made progress on today, and then the rest?
and I still don’t know exactly where the 2 comes from.
It would be nice if the API could answer questions like “How many safe days remain?” or “What was the total for this day?” and hide some of the extreme detail from clients that don’t need it.
So long as the eep days sort somewhere toward the top, I don’t think it needs to be a separate section. I kind of liked seeing the highlighted strips. But even after glancing at the code, I can’t grok the sort order.
Aside: I’m glad to have tried this out, but don’t carry on tweaking on my account. Scratch your own itches first! I’m also glad to have this example to serve as a foundation if I ever embark on a dashboard of my own. Right now it’s not going to fit in my life.
Yeah it started off simple and somehow morphed into a 3 line lambda. The sorting is:
Primary: Was there any progress today? (It’s actually looking at if all the data for today, taken together, result in a non-zero diff)
Secondary: Goal type (I wanted to put my hustler goals above my drinker goals, but python takes key functions instead of cmp functions, so the only way to reverse the order is to negate a numerical value (since you can’t negate a string) so I took the ordinal value of the first character of the goal_type (since they happen to start with different letters))
Tertiary: Alphabetical by goal title
Safe days / eep aren’t considered at all for the sorting. I felt like the default beeminder.com dashboard did a good enough job of displaying which goals need work soon.
Previously when I suggested putting eeps into their own section, that would be just because I can see how eep/no_eep is pretty fundamental. But I wouldn’t want to sort non_eep’s by safe days.
Sure thing! I didn’t expect anybody to say “Omg I’ve been waiting for this exact Web 1.0 geocities style dashboard my whole life”
We have losedate which gives the timestamp you’ll derail. (Grep for it in the API docs.) We were thinking that’s easier to work with than number of safe days since it doesn’t become immediately stale when you store it.
You’d like that for arbitrary days in the past? We have curval for today’s value. Internally we have a parameter asof to generate the graph and all the statistics as of arbitrary timestamps. We could potentially expose that, but it’s easier said than done since we don’t want to let you permanently mess with the asof date. Agreed that it’s way too hard to get this sort of thing currently, especially if it means reimplementing the aggday function clientside. But let me know the use case before we put too much thought into it.
I’m a little behind in this discussion now. Any other loose ends I should look at? Thanks again for sharing the dashboard! Like @philip said, this is exactly the kind of thing that helps push the API forward so complain loudly even about quibbles.
Well, the use case is trying to compute the increase/decrease in a goal’s value over a period of time. I can’t do that without reimplementing aggday because I need to know how the goal’s value changed each day in the period. Currently the dashboard handles “sum” and “last” correctly, but it will munge all the other aggdays which I haven’t reimplemented.
Today my dashboard pulls all the data points for every goal in the last 4 weeks. If I could ask “What was the value on date X?” I could reduce it to pulling 4 data points per goal (4 weeks ago, 2 weeks ago, yesterday, and today).
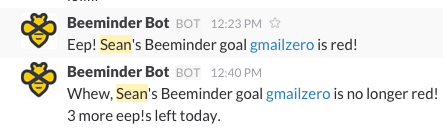
Beedash now has a Slack integration. I’ve been running this locally for a looong time but I finally got around to checking it in. It’s still really hacky though.