I have a lot of goals that get many data points posted to them per day. A question I often have is, “What’s the sum of this goal’s data points for this specific date?” It doesn’t seem like there’s an easy way to get that answer.
Adding them up myself is tedious.
Writing a script feels like overkill.
Downloading a CSV and opening it in a spreadsheet program is cumbersome and not mobile-friendly.
Am I missing something? And, if not, could something to make this easier be added to the Statistics tab?
@adamwolf Hmm, hadn’t really thought about it. Usually I am looking for sum, I think. If it was based on aggday, would that mean I’d be required to convert the goal to a custom goal in order to get that info?
@philip Histogram view sounds intriguing. So I’d be able to see what proportion of days I entered a total value over 2, for instance? Or am I incorrectly imagining how that would work?
Maybe I’m confused about aggday. But, honestly, I don’t care if I need to change the goal to a custom goal and convert its aggday to sum or not, as long as I can access the sum for each day in the web interface.
(Sorry for this being a reply to you, @philip. I’m not sure how to remove the reply-to reference once it’s there…)
here’s a quick hack, if I understand what you’re asking after briefly skimming, and if you can run python3 scripts and install python packages… you’ll need requests and matplotlib. create hack.py with this code and run it.
import requests
from datetime import date
from matplotlib import pyplot as plt

token = input("Enter your auth_token from https://www.beeminder.com/api/v1/auth_token.json: ")
token = token.strip()

user = requests.get("https://www.beeminder.com/api/v1/users/me.json?&datapoints=true&auth_token={}".format(token)).json()

print()
print("Which goal would you want to chart?")

for idx, goal in enumerate(user["goals"]):
    print(goal)
    print("{}: {}".format(idx, goal))


print()
print()
choice = input("Your choice: ")
try:
    choice = int(choice.strip())
    if choice < 0 or choice >= len(user["goals"]):
        raise Exception()
except:
    print("Choice must be an integer between 0 and {} inclusive".format(len(user["goals"]) - 1))

print()
print()

goal = requests.get("https://www.beeminder.com/api/v1/users/alice/goals/{}.json?&datapoints=true&auth_token={}".format(user["goals"][choice], token)).json()
offset = (3600 * 24) - (goal["losedate"] % (3600 * 24))
orig_datapoints = goal["datapoints"]

orig_datapoints = [{"value": d["value"], "date": date.fromtimestamp(d["timestamp"] - offset)} for d in orig_datapoints]
orig_datapoints = sorted(orig_datapoints, key = lambda x: x["date"])

datapoints = []
for orig_dp in orig_datapoints:
    if len(datapoints) > 0:
        last = datapoints[-1]
        if last == orig_dp:
            datapoints[-1]["value"] += orig_dp.value
    else:
        datapoints.append(orig_dp)

plt.bar([x["date"] for x in orig_datapoints], [x["value"] for x in orig_datapoints])
plt.show()
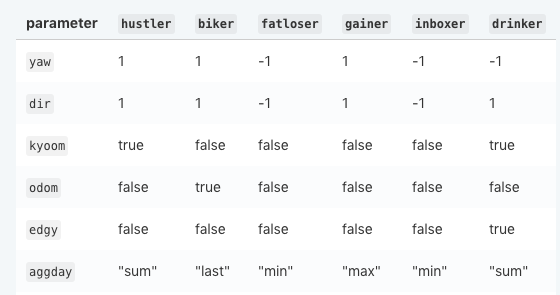
There are not many situations where you’d want to look at the result of an aggday method you’re not using. In particular, if you want to look at “sum,” it’s unlikely that goal would use a different aggday method. For instance, the “inboxing,” “fatloser,” and “gainer” goals check a measurement multiple times throughout the day (weight or emails left) and use aggday to choose one - you’d never want to take the sum of all your weighings throughout the day.
@zedmango Yeah, that’s fine. But, regardless, I don’t think you can see the result of it. Unless I’m missing something.
@eugeniobruno Thank you! Yes, I do use Python to extract stats some times. But having to do this seems pretty onerous, and also excludes people who aren’t as handy with scripting as you and I are.