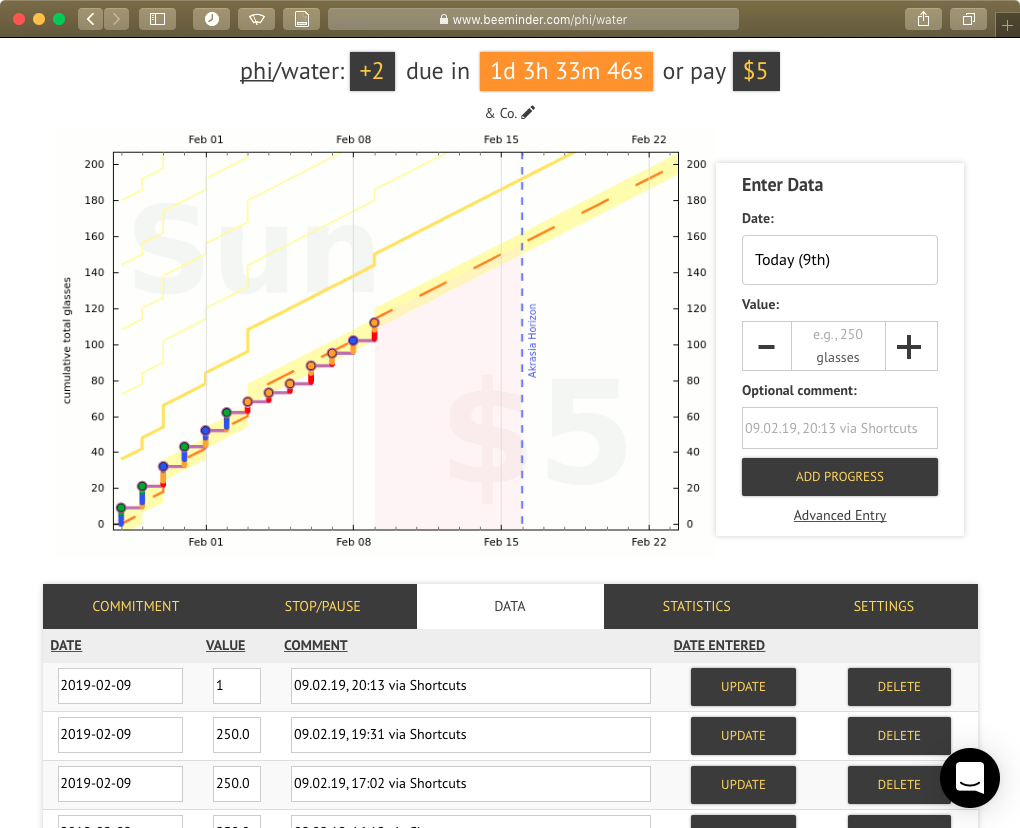
I scaled by 0.004 which should have converted 250 to 1:
Note that the graph looks fine, just the table underneath is confused. After a page refresh the table is fine, too:
This works the other way around, too (scaling by 250).