svg graphs

One thing on the way to js graphs is that the graph library now generates, in addition to pngs, an svg version of the graph. These are nice because they scale beautifully and give much better definition of the different graph elements. They have the downside of being larger when there are lots of things (road rows, datapoints) in the image.

So we’re planning to switch over to using svgs in the website, but… we will want to fall back to pngs in the case of there being no svg for a graph, and maybe we want to do that in other cases as well? Possible times we might want to fall back to pngs:

  • if no svg
  • if the user-agent shows it’s a mobile device
  • if it’s not your own goal
  • if the goal is over some threshold for #of datapoints or road rows
  • ??
5 Likes

I hope you keep the svgs for mobile devices!

1 Like

my thinking was that you might care a lot more about the size of stuff you were downloading on a mobile device.

3 Likes

I suspect many people have high-speed data or else will be on wireless a lot of the time with their mobile devices and would prefer the better quality graphs! I personally would not want the mobile graphs crippled.

How big are we talking here? Unless the graphs are truly huge I can’t imagine the data being an issue.

Regarding the limit on the number of datapoints, even though goals with larger datapoints do indeed have larger svg’s, they also possibly correspond to more advanced users who might have a stronger preference for svg graphs.

SVG sizes range from 15Kb to 1.7Mb depending on the number of datapoints and road inflections. Most of them are under 1Mb though for small to mid-size goals. In contrast, PNG’s range from 10Kb to 40Kb, increasing with visual complexity and the number of different graph colors.

2 Likes

Does this mean you could reveal info about each data point on hover? Date, point value, cumulative value, comment… That would be sick.

2 Likes

On the remote chance you did not try this already: Have you gzipped the SVGs?

3 Likes

Sad to lose the Captain :frowning:

The problem is that the size difference is so small that gzipping and gunzipping (or bzip2ing and bunzip2ing) may well take more time than just transfering the entire file uncompressed.

Yes, this!

I don’t have any Beeminder graphs at hand (or the time sadly) to explore this myself but this here doesn’t look too bad I don’t think:

and this:

So I dare say: Throw an SVG minimizer at it, then gzip it, look at the result with gzthermal to see where it fails to compress it adequately.

If this doesn’t help how about sending the datapoints to the client directly and let it do the job? It’s d3.js after all. I mean I’d prefer SVG but I’d rather have that than some PNG file.

1 Like

In case this comes across as me just having googled something y’all already thought of (It’s not what it looks like, really!), please accept this cookie as present: :cookie:.

On a more serious note: I really like the idea of gzipthermal. Sadly it doesn’t seem to be available as source.

Another thing that might work to save lots of space (Again: I don’t know how these specific svgs look like) is putting all repeating style definitions in a separate file and referencing it with the use tag.

I got some more advice that nobody asked for :wink:

<path class="aura" d="M8.883495145631068 381.37457763443 
L10.738226317892433 380.3215352131302 
L12.592957490142338 379.26990221855243 
L14.447688662415164 378.21965378624475
 L16.302419834665066 377.1707650517745 
L18.157151006926433 376.1232111506896 
L20.011882179176336 375.0769672185446 

I don’t think anyone will ever appreciate the precision of these coordinates. Thus it is fair game to round them to, say, 2 or 3 decimal places. This will get rid of a LOT of information that would get rounded to Ints eventually anyway. And then any lossless compression will have a much easier job.
From the rounding alone I expect this to reduce the SVG’s size by about 50% already. These path definitions seem to be the bulk of the data in them so it really pays off to optimise there when you want to save space.

…which is precisely (pun intended) what svg optimizers do. Such as this one which is also a node.js module:
https://jakearchibald.github.io/svgomg/

and it reduced the SVG of my workout goal from 25.13k to a mere 3.26k gzipped which is 12.98% its size.

Mobile users with 2G or Edge will thank you. I mean, realistically speaking they won’t, but they won’t be disappointed by the app taking forever to load these graphs.

OK, I’ll shut up now :wink:

3 Likes

I don’t think anyone will notice a difference in loading 22k less. Besides aren’t these values stored as floating point data types anyway, so they’d take up the same amount of space?

You are thinking of when they are deserialised and loaded in RAM again. Then, yes, they would most likely be deserialised to 32 bit IEEE floats again irrespective of their actual imprecise value. But that’s not the point.

In the SVG they are serialised as text. The string “3.14159265359” needs more bytes to store than “3.14”. It contains more information according to good old Shannon. Information we don’t necessarily need.

The idea is to reduce the SVGs in size so much that they will always be at least as small as their PNG counterpart so no fallback to rasterised PNG was necessary. Smaller size directly translates to faster loading time. And reduced bandwidth costs for the Beeminder infrastructure (if that even is a factor in this equation).

2 Likes

Meanwhile on the website of a well known book store:

image
Does that illustrate my (decimal) point? :wink:
Seems you are in good company!

Speaking of which:

Well, that’s for one single SVG. For one user. Let’s do some milk maiden math: Assuming 2000 users all look at one graph each day then after 30 days we get:

  • 1.43 GiB of raw SVGs
  • vs. 0.19 GiB of gzipped optimised SVGs

Then there is also the many graphs on the dashboard. They are PNG thumbnails as of now but I hypothesize (!) that a sufficiently reduced SVG beats a PNG in terms of size even there. And who knows how that would scale. Actually, the Bee team would know :thinking:

Now to the obvious elephant in the room: Do the Beeminder servers care? In a time where people upload videos as GIFs? Probably not from a bandwidth perspective but if the CDN charges per GiB transferred then this calculation might look different all of a sudden. But then processing power isn’t exactly free either. An optimisation problem! Great!

2 Likes

Ta-da!

http://beeminder.com/changelog#2949

Thanks so much for figuring that out, @phi!

2 Likes

Curious what kind of size changes you saw with this tweak?

umm… i forget… :frowning: But I can just re-run it!

So, grabbing one of my bigger data sets – daily+ weight data back to 2007:

Pre compression: 1.5M svg, 76K png
Post compression: 862K svg, 76K png

3 Likes

56% of its original size, close enough :slight_smile:

1 Like

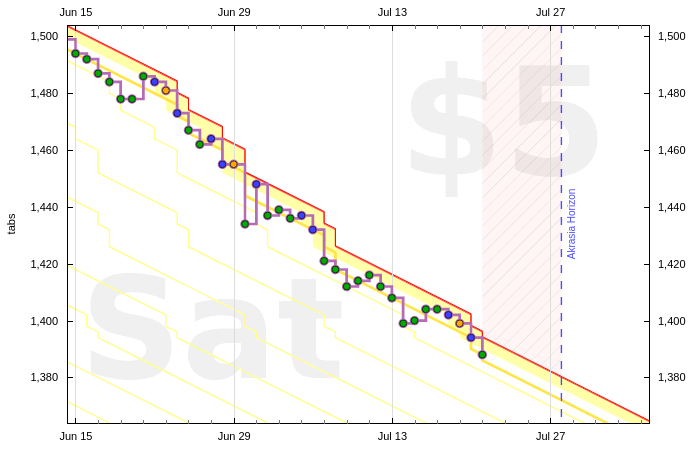
I have to say, I’m finding the size of the SVG graphs to be more and more painful as time goes on. Take, say, this perfectly ordinary graph:

The visible part of the graph is not that large or complex (because it’s truncated, with an x-min of 2020-06-15), and as a PNG the image is 24KB. As an SVG, however, it’s an order of magnitude larger, at 720KB.

This is quite painful. I don’t know why my connection to bmndr.s3.amazonaws.com is so slow, but this is the result:

Screenshot from 2020-07-21 17-47-05

(Perhaps it’s a matter of the region the bucket is in? I’m probably on the other side of the world from it. I don’t think it’s a problem with my internet connection: fast.com shows a download speed of 3.5MB/s, and even if it was a slow connection: the fact remains that in practice, the larger SVGs are painfully slow for me.)

By the way: gzipping this particular SVG reduces it from 720KB all the way down to 76KB. And brotli compression yields an even better result, weighing in at only 48KB.

If I optimize the SVG it with svgo (the command line version of the same tool @phi was talking about), that reduces the uncompressed size to 134KB; or 16KB gzipped; or 12KB compressed with brotli! (Half the size of the PNG version.)

So at the very least, it seems compressing it would be a really big win. For those that are harder to compress, there are other optimization tricks you could try: for instance, because the PNGs are quite lightweight, a decent strategy might be to first load the PNG, then load the SVG in the background with javascript, and then switch out the PNG for the SVG once it has loaded.

This uses a tiny bit more bandwidth (loading both the PNG and the SVG), but it gives a much faster loading speed even in the cases where the SVG is large even compressed.

I’d also look into how the S3 bucket is configured. If I’m right, and the slowness is a matter of me being very far from the AWS region where the bucket is hosted, there are ways to improve this. You could set up some sort of cross region replication thing to host the graphs in multiple regions around the world, or better yet, you could set up Cloudfront (or another CDN) in front of the bucket.

Cloudfront, being AWS’s CDN, has a great integration with S3. It’s really easy to set up a Cloudfront distribution that just serves content out of an S3 bucket, and you can also configure things like automatic gzipping. The pricing math works out fairly similar: by my calculations, the network transfer prices for S3 and Cloudfront work out about the same for files around the size we’re talking about here.

I strongly suspect (but can’t prove), that using Cloudfront would help a lot. But of course, you could do some or all these various optimizations at once: they all should play well with one another.

4 Likes

I agree with all of these points, zzq, and once again, thanks for your clear, actionable, insights.

3 Likes